This creates a special type of ggplot2 Layer object. The layer searches for a tdmorefit object in either the plot, or its own arguments. It then calls the `predict()` function and provides this data.frame instead of the original data
Source:R/ggplot.R
predictionLayer.RdYou can use this just like a regular `layer` call. Beware that this function does not warn you about spurious or misspelled arguments, as these will be passed along to `predict()` instead.
predictionLayer(
  mapping = NULL,
  data = NULL,
  geom = "line",
  stat = "identity",
  position = "identity",
  ...,
  n = 101,
  show.legend = NA,
  inherit.aes = TRUE
)
Arguments
| mapping | Set of aesthetic mappings created by |
|---|---|
| data | The data to be displayed in this layer. There are three options: If A A |
| geom | The geometric object to use display the data |
| stat | The statistical transformation to use on the data for this layer, as a string. |
| position | Position adjustment, either as a string, or the result of a call to a position adjustment function. |
| ... | extra arguments, which go partly into the geom/stat parameters, and partly into extra_params (which go into the `predict` call) |
| n | Specifies whether the prediction must be performed on interpolated points along the x-axis. |
| show.legend | logical. Should this layer be included in the legends?
|
| inherit.aes | If |
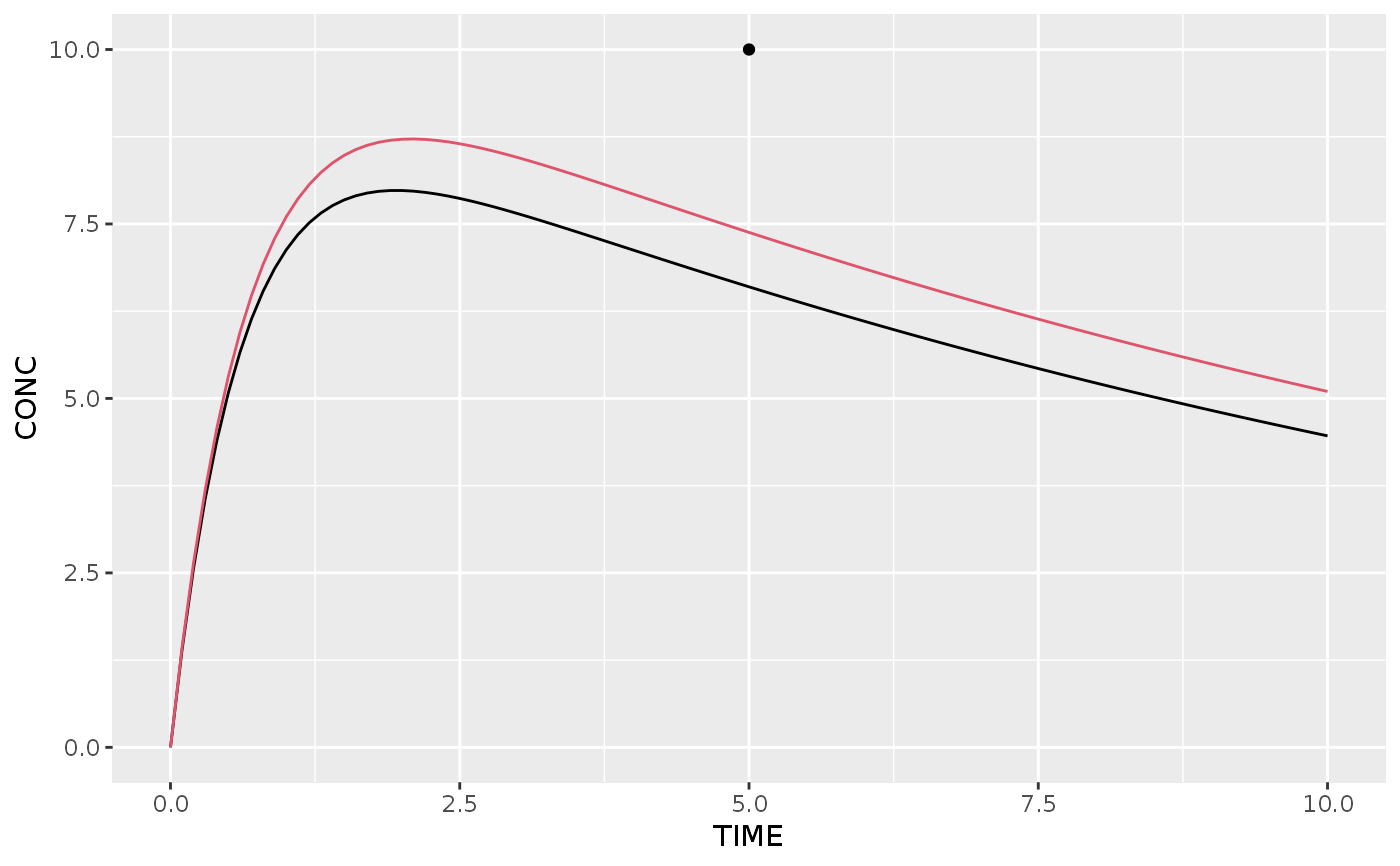
Examples
#>db <- dataTibble( observed=data.frame(ID=c(1,2), TIME=5, CONC=c(10,15)), regimen=data.frame(TIME=0, AMT=5) ) pred <- posthoc(object=m1, db) ggplot2::ggplot(pred$fit[[1]], ggplot2::aes(x=TIME, y=CONC)) + ggplot2::geom_point() + predictionLayer(newdata=seq(0, 10, 0.1)) + predictionLayer(data=pred$fit[[2]], newdata=seq(0, 10, 0.1), color=2)